
Detecting Entrained Signals - Part II
TLDR; I detected entrained brain waves from the EEG headset.
Continuing from the last post, I’ll recap what we’re working toward and the topic of this post. The goal for this experiment was to watch a video on a computer screen that flashes essentially a strobe light at a defined frequency such as 10 or 12hz and then be able to detect the entrained brainwaves in the EEG recording. If we can detect a signal in our brainwaves, we can use it to issue commands.
Here’s our outline:
- Create the visual stimuli - previous post: Entrainment with Visual Stimuli
- Record the EEG signal while watching the videos - partially covered in the previous post: Detecting Entrained Signals - Part I
- Analyze the data and try to detect the entrained signal - algorithmic part of today’s topic
- visual portion covered in the previous post: Detecting Entrained Signals - Part I
Analyze the data and try to detect the entrained signal
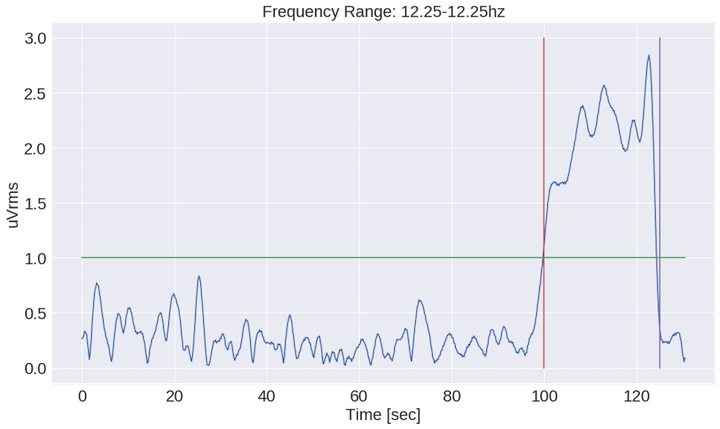
What you see in the graphic above is a 12hz cross section from the STFT output. Let’s look at the code that generated this plot.
def freq_filter(t, freqs, power, min_freq=10.0, max_freq=10.5, plot=True, threshold=3, vertical_plots=None, height=None):
    """Allows you to filter down to a frequency band and measure the mean signal strength.
    Optionally plot results."""
    condition = (freqs <= max_freq) & (freqs >= min_freq)
    indices = np.where(condition)
    power = np.abs(power)
    filtered_signal = np.mean(power[indices], axis=0)
    signal_length = len(filtered_signal)
    threshold_line = signal_length*[threshold]
    if plot:
        plt.figure(figsize=(16,9))
        plt.title('Frequency Range: {}-{}hz'.format(min_freq, max_freq), fontsize=22)
        plt.ylabel('uVrms', fontsize=22)
        plt.xlabel('Time [sec]', fontsize=22)
        plt.xticks(fontsize=22)
        plt.yticks(fontsize=22)
        plt.plot(t, filtered_signal)
        plt.plot(t, threshold_line)
        if vertical_plots:
            for val in vertical_plots:
                plt.plot([val]*height, range(height))
        plt.show()
    return filtered_signal
Building off of the last post, we’ll pass the time values, t, frequencies, and the power array (called Zxx in the last post) as well as a frequency range to narrow our results down. If we’re interested in looking at the signal strength in the 12hz range, we should probably look somewhere between 11.75-12.25hz. By taking advantage of numpy’s indexing functions such as np.where, we can drill down to the cross section of interest and take the average signal strength through time. Intuitively, we would expect the 12hz signal strenth to increase when we are entraining with a 12hz frequency.
From there we can plot the results and add in a couple extra lines to give us a visual sense of a plausible threshold. Perhaps we can define a threshold, above which we say the signal has been detected, below which we say the signal has not been detected. You can play around with the threshold - and therein lies the issue.
Due to cross-session differences (i.e. each time you put the EEG headset on), the threshold changes, likely due to the varying impedence on the electrodes. As such, it would be good if we could find a way to stabilize this threshold. One approach that came to mind was to normalize this signal by some other base signal such as the mean signal between 2-20hz. That mean of that range should basically just be noise. I’m literally creating a signal-to-noise ratio. Normalizing leads to far more stable results, and even improves our precision and recall scores quite dramatically for the 8.6hz and 10hz signal.
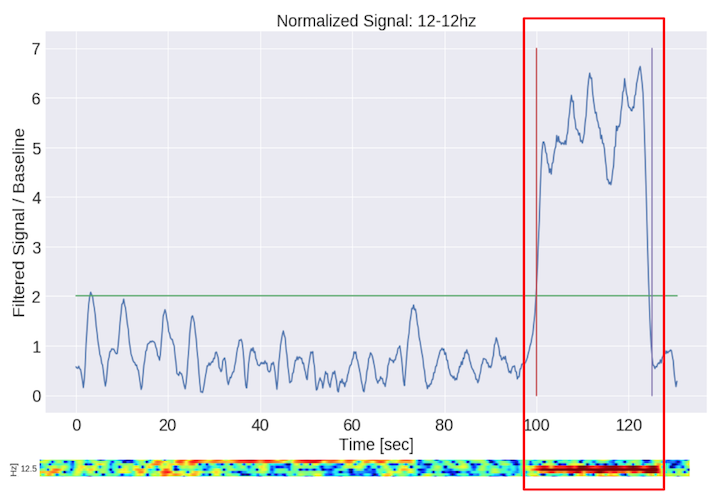
What you see in the graphic above is a 12hz cross section from the STFT output. Below the main plot, I included a cropped cross-section from spectrogram to drive the point home. The red in the spectrogram corresponds to the greater uVrms values in the plot above. Now let’s look at the code that generated this plot.
def plot_normalized_signal(t, freq, filtered_signal, normalizing_signal, threshold=1, vertical_plots=None, height=None):
    """Normalize the signal detection by another signal, which makes the
    threshold more robust to individual and cross session differences. Plot the results."""
    plot_signal = filtered_signal / normalizing_signal
    signal_length = len(plot_signal)
    threshold_line = signal_length*[threshold]
    plt.figure(figsize=(16,9))
    plt.title('Normalized Signal: {}-{}hz'.format(freq, freq), fontsize=22)
    plt.ylabel('Filtered Signal / Baseline', fontsize=22)
    plt.xlabel('Time [sec]', fontsize=22)
    plt.xticks(fontsize=22)
    plt.yticks(fontsize=22)
    plt.plot(t, plot_signal)
    plt.plot(t, threshold_line)
    if vertical_plots:
        for val in vertical_plots:
            plt.plot([val]*height, range(height))
    plt.show()
    return plot_signal
This function is almost exactly the same as the one earlier in the post except this time the function takes a pre-filtered signal, and a normalizing signal in as arguments.
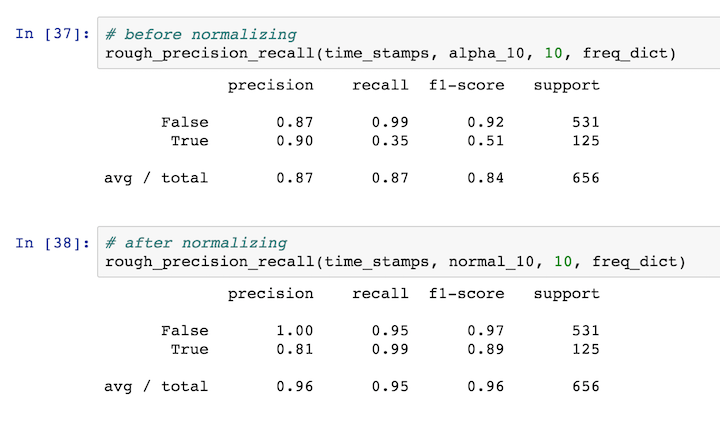
So how good are we doing? We’re able to detect our signal based on our naïve threshold approach. We can more rigorously evaluate our precision and recall metrics for the different signals. I was pleased to see the 10hz results improve so dramatically after using the normalizing technique described above. The rough idea here is that if we increase the threshold, we would expect precision to increase at the expense of recall. In other words, we’re being more selective about our detection criteria and thus more accurate in our predictions but the downside is a high false negative rate. On the flipside, lowering the threshold will result in higher recall and more false positives.
With all of this in place, we are now ready to run some live experiments. Let’s say we can detect 10 and 12hz with high fidelity, what should we do once we detect those signals? Turn the TV on? Issue commands to a robot? Move a CAT across the screen?!?! This wouldn’t be the internet if we didn’t do something with a cat. Take a look at the next post.

Leave a comment